Histogram in Excel: How to Create and Customize for Data Analysis
December 21, 2024To create and customize a histogram in Excel for data analysis, start by selecting your data range. Go to the "Insert" tab and choose the histogram option. If you're using an older version of Excel, make sure the Data Analysis ToolPak is enabled. Adjust bin width and the number of bins to refine your histogram's appearance. You can also use the FREQUENCY function for dynamic updates and create clear visualizations. Don't forget to add titles and labels for clarity. There's so much more you can explore to enhance your histograms, so let's take a closer look at advanced techniques next!
What Is a Histogram?
A histogram is fundamentally a graphical tool that helps you visualize the distribution of numerical data. It's a type of graphical representation where data is grouped into specified ranges called bins. The height of each bar indicates the frequency distribution of data points within those ranges. Unlike bar charts, histograms have no gaps between the bars because they represent continuous data rather than distinct categories.
In your data analysis process, you'll find histograms incredibly useful for identifying patterns and trends in large datasets. They quickly reveal the overall shape of your data distributions—whether they're normal, skewed, or bimodal. By mastering histograms, you can enhance your expertise in specific fields, which can help you stand out in competitive markets.
The choice of bin width and the number of bins can greatly impact how the histogram appears and how you interpret it. Common methods for determining these parameters include Sturges' formula and the Rice rule.
Histograms serve as powerful tools for understanding data variability and central tendency. By visualizing your data this way, you can make more informed, data-driven decisions. Whether you're using Excel or another tool, mastering histograms is essential for effective data analysis.
Creating a Histogram in Excel
Creating a histogram in Excel opens up a world of data visualization possibilities. If you're using Excel 2016 or later, you can easily create a histogram by selecting your data range, moving to the "Insert" tab, and choosing the "Histogram" option from the "Charts" section. This instantly generates a histogram chart for you.
Utilizing effective tools for task management can also help streamline your data analysis processes.
To customize your histogram, right-click on the horizontal axis to access the Format Axis pane, where you can adjust the bin width and specify the number of bins. This allows you to refine how your data is grouped.
If you're using an older version of Excel, you'll need to install the Data Analysis Toolpak by going to the "File" tab, selecting "Options," and checking the "Analysis ToolPak" option under Add-ins.
For a more dynamic approach, consider using the FREQUENCY function. Define your data and bins, then remember to enter the formula as an array using Control + Shift + Enter.
Once your histogram is created, enhance it by adding a descriptive chart title and labeling the axes for better clarity.
Using Data Analysis ToolPak

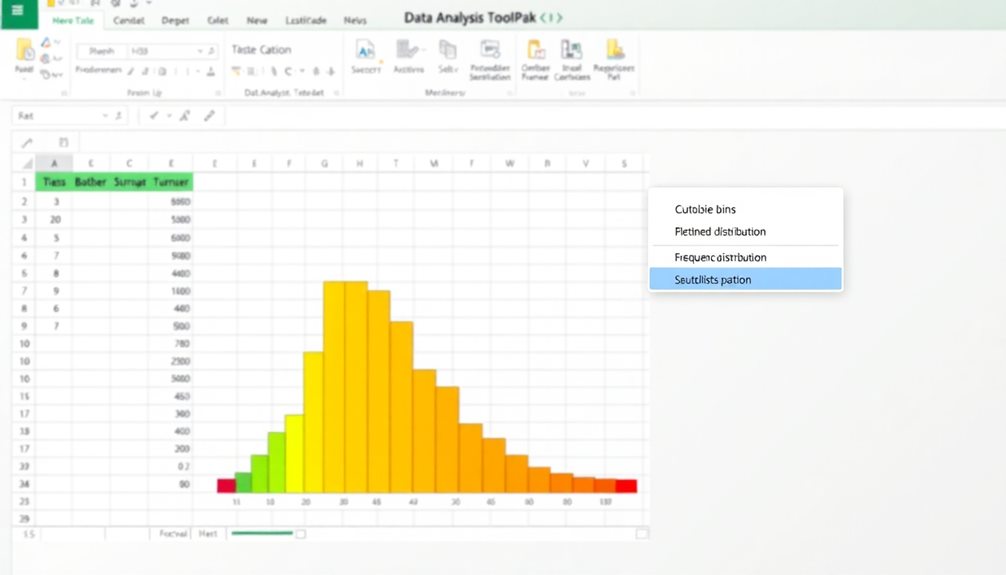
Using the Data Analysis ToolPak in Excel streamlines the process of creating histograms, making it accessible for users at all experience levels. First, verify the ToolPak is enabled by going to File > Options > Add-Ins, selecting Excel Add-ins, and checking the Analysis ToolPak option.
Once activated, head to the Data tab, click on "Data Analysis," and choose "Histogram" from the list. This tool is particularly useful for enhancing data visualization and identifying trends within your dataset, as it allows you to categorize data intervals effectively. For more advanced formatting options, consider using dynamic rules to adjust your histogram automatically based on changes in your data.
To create a histogram, enter your data in the "Input Range" field. Specify your bin range to categorize your data into intervals for accurate frequency distribution. You'll also need to choose an Output Range for where you want the results to appear.
Don't forget to enable the "Chart Output" option to generate a visual representation alongside the frequency table.
After creating your histogram, you might want to format the histogram for better clarity. Adjust bin widths, add labels, and consider removing unnecessary elements like legends to enhance presentation.
This way, the histogram not only represents your data effectively but also looks polished and professional.
Histogram With Formulas
Histogram With Formulas
Building a histogram with formulas in Excel offers a flexible approach to visualizing data distributions. To create a histogram, you'll use the FREQUENCY function with the syntax '=FREQUENCY(data_array, bins_array)'. This function counts the number of occurrences within your defined intervals.
First, enter your bin values in a separate column. Next, select the adjacent cells where you want the frequency output to appear. Implementing automation tools like this can enhance your enhanced productivity by streamlining repetitive tasks and allowing focus on meaningful analysis.
To properly enter the FREQUENCY function, remember to press Control + Shift + Enter to input it as an array. The resulting frequency array will automatically update when your source data changes, giving you a dynamic histogram representation.
Once you have your frequency distribution, visualize it by inserting a clustered column chart based on the frequency results. For a more traditional histogram appearance, format it to remove gaps between the bars.
Keep in mind that the FREQUENCY function also counts values exceeding the last bin, ensuring you include all data points in your analysis. This method empowers you to effectively analyze your data and gain insights through visual representation.
Customizing Your Histogram

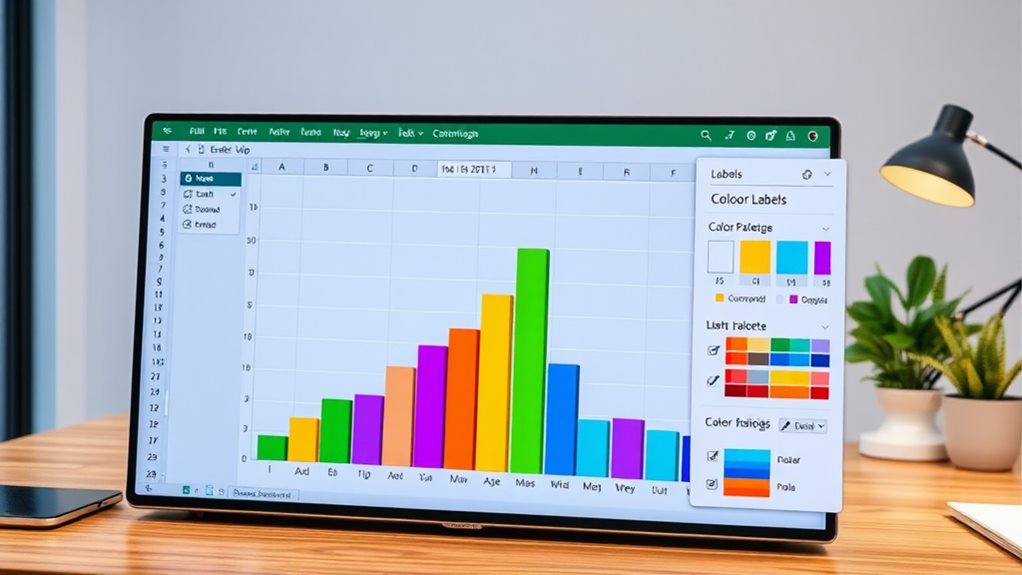
When it comes to customizing your histogram in Excel, making small adjustments can greatly enhance its clarity and impact. Start by right-clicking the chart title and edit it to give a clear description of the data represented.
Additionally, utilizing effective tools can enhance the overall presentation of your data visualizations, as seen in task management tools that improve project organization.
Next, adjust the bin width and the number of bins by right-clicking on the horizontal axis and selecting "Format Axis." Enter your desired values under the "Axis Options" section.
To improve readability, remove gaps between the bars by selecting them, right-clicking, and choosing "Format Data Series." Set the "Gap Width" to 0% for a cleaner look.
Enhancing the visual appeal of your histogram is also important. You can add data labels to each bar by right-clicking on the bars and selecting "Add Data Labels." This step helps convey precise information at a glance.
Advanced Histogram Techniques
Advanced histogram techniques can greatly enhance your data analysis in Excel. One powerful method is using the FREQUENCY function, which updates your histogram automatically as you modify your Excel data. This technique aligns well with essential concepts in cloud computing basics.
Remember to enter it as an array formula by pressing Control + Shift + Enter for accurate results. If you want to create a histogram from summary data, simply select your frequency data and use a 2-D Column chart. Be sure to replace the default axis labels with appropriate bin numbers for clarity.
For more customizable histograms, try the COUNTIFS function. This allows you to define frequency distributions across specific intervals or conditions, tailoring your data analysis to your needs.
If you're looking for a quick setup, the Data Analysis Toolpak is invaluable. It helps you create a histogram by specifying input and bin ranges, streamlining your frequency analysis.
Tools for Enhanced Efficiency

To boost your efficiency in Excel, consider using add-ins designed specifically for productivity.
These tools simplify data management tasks and enhance text manipulation, making your workflow smoother and faster.
Additionally, implementing automation tools like streamlining processes can further enhance your data handling capabilities.
Excel Add-ins for Productivity
Excel add-ins consistently enhance productivity by providing users with powerful tools that streamline various tasks. One of the most beneficial add-ins is the Analysis ToolPak, which equips you with a suite of data analysis tools, allowing you to create a histogram and perform statistical analyses effortlessly.
To install the Analysis ToolPak, just navigate to File > Options > Add-Ins, select Excel Add-ins, and check the ToolPak option for immediate access.
Once installed, you can easily customize your data analysis workflow. The Analysis ToolPak enables you to analyze frequency distributions, which is essential for understanding your data sets better.
Furthermore, tools like the Ultimate Suite for Excel offer over 300 time-saving options that improve overall productivity by simplifying tasks such as merging worksheets or removing duplicates.
For text manipulation, a text toolkit can help you handle over 35 different functions, enhancing your data management capabilities.
In addition, customizable email templates can streamline your communication, ensuring consistent responses across your team.
Time-Saving Data Management Tools
Many users discover that utilizing time-saving data management tools can greatly enhance efficiency in their daily tasks. With the Ultimate Suite for Excel, you gain access to over 300 tools designed to streamline your data management processes. These tools can help you merge multiple worksheets, compare sheets, and remove duplicates, considerably boosting your productivity.
The Text Toolkit within Excel is another invaluable asset, offering more than 35 options for text manipulation. You can format and edit data swiftly without getting bogged down in manual tasks.
Additionally, creating customizable templates for your routine email replies guarantees consistent communication across your organization, making your workflow smoother.
These time-saving tools allow you to tackle frequent inquiries quickly, minimizing the time spent on repetitive tasks. By leveraging these resources, you can focus on more complex data analytics and decision-making tasks that require your attention.
Whether you're analyzing frequency distribution or refining Excel formulas, these tools pave the way for enhanced efficiency. Embracing such data management solutions won't only save you time but also elevate your overall productivity.
Advanced Text Manipulation Features
Advanced text manipulation features in Excel can transform the way you handle data, making processes faster and more efficient. With over 35 functions at your disposal, you can easily merge, split, and format text strings, streamlining data entry and organization.
Here are some key benefits of using these advanced tools:
- Remove duplicates: Enhance data cleanliness by ensuring your datasets contain only unique entries.
- Trim excess spaces: Improve data quality for accurate analysis by eliminating unnecessary whitespace in your text.
- Customizable templates: Create email templates that foster consistency in communication, especially for routine inquiries.
- Company-wide signatures: Implement professional signatures in your Excel emails to boost branding consistency.
- Boost productivity: Reduce manual effort and time spent on administrative tasks, allowing you to focus on more critical aspects of data management.
Conclusion
Now that you've revealed the secrets to creating and customizing histograms in Excel, picture your data transforming into vibrant bars, each representing valuable insights. By mastering these techniques, you're not just crunching numbers; you're weaving a visual tapestry that tells a story. So, dive back into your data, experiment with those advanced features, and let your histograms illuminate patterns you never noticed before. With every chart you create, you're becoming a more skilled analyst!

